Disappearing Act: Earnings

Stocks continued their ascent of the past couple of weeks, likely driven by hopes for a "step down" (less aggressive pace of rate hikes) by the Federal Reserve, but also aided by positive seasonals and sentiment that had become washed out. We're also in the midst of the meatiest part of third quarter earnings season, with last week bringing some of the highest-profile reports. So far, S&P 500 earnings growth has been better than expected.
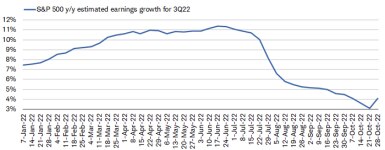
The reason for the italics above is due to analysts having set the bar quite low. As shown below, from a late-June high of more than 11% year-over-year growth, the "blended estimate" (combining actual reports with estimates for not-yet-reported companies) recently sank to less than 3% before last week's uptick to 4%. That is for the overall S&P 500—excluding the Energy sector, earnings are expected to fall by nearly 4%.
Lowered bar
Source: Charles Schwab, I/B/E/S data from Refinitiv, as of 10/28/2022. Forecasts contained herein are for illustrative purposes only, may be based upon proprietary research and are developed through analysis of historical public data.
Beat it
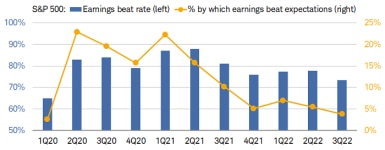
Even with the lowered bar, the "beat rate" (percentage of companies exceeding consensus expectations) continues to weaken relative to the historic highs during the first half of last year. As shown below, 73% of companies have beaten expectations to the collective tune of only 4% (also well down from more than 20% at the start of last year).
Descending beats
Source: Charles Schwab, I/B/E/S data from Refinitiv, as of 10/28/2022.
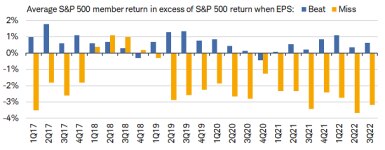
Notwithstanding the market rally overall, stocks of companies missing the expectations boat have been drowning relative to the reporters of better-than-expected results. As shown below, on the trading day of earnings releases, the misses have been down by more than 3% on average, with the beaters rewarded with a proportionally lower positive return of less than 1%.
Misses getting hit hard
Source: Charles Schwab, Bloomberg, as of 10/28/2022. Past performance is no guarantee of future results.
Micro misses and macro headaches
A glaring feature of this earnings season has been the string of high-profile misses—most notably, among the largest companies in the S&P 500. Though we tend to conduct analysis in a top-down, big-picture manner, we find it important—especially in today's environment—to pay attention to bellwether companies that wield outsized influence on the economy's path. As such, revenue misses and cuts to forward guidance from the likes of Meta (formerly Facebook) and Amazon capture the zeitgeist of what plagues both the market and economy today: a relentless move higher in the U.S. dollar (USD), the spike in interest rates, and slowing consumer demand.
Starting with a relative bright spot, the largest company in the world—Apple—pulled in record revenues of more than $90 billion during the third quarter. Executives for the most part were optimistic on iPhone demand and a continued easing of some supply constraints. Yet, despite growing sales under the weight of a 6% foreign-exchange headwind, executives are seeing more pressure ahead and expecting that drag to grow to 10% in the next quarter.
Results for other mega caps were far less sanguine. Google's parent, Alphabet, saw significant slowdowns in advertising and services revenue alongside a huge miss in operating income. It was Google's fifth straight quarter of slowing sales growth. Microsoft posted its weakest sales growth in five years, courtesy of the strong dollar, rising energy costs in Europe, and a decline in PC demand.
Amazon's operating margin and income missed estimates by a wide degree, and executives are expecting a 4.6% drag on revenue from the strong dollar. Meta reduced its guidance for the coming quarter, has started to reduce headcount, and is expecting a 7% drag on revenue from currency pressure. The company is under pressure from its own idiosyncratic headwinds—one being soaring expenses for its investment in the Metaverse—which have been exacerbated by the weakening global backdrop.
While these companies' results—among others—have given us more insight into the waning strength of the consumer and stronger grip of foreign-exchange volatility, there is still a larger question as to how much the aggressive monetary policy tightening this year will likely crimp demand moving forward. What is increasingly clear, though, is that the leadership profile for the market continues to shift dramatically relative to recent history.
Dollar demon
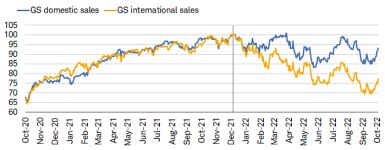
Specific to the epic surge in the USD, the impact has been felt most by stocks of companies that derive a larger portion of their revenues from international sources. Case in point is the notable outperformance of Goldman Sachs' "domestic sales" index relative to its "international sales" index, shown below (see footnote for details). Rough estimates are that every 1% change in the value of the USD leads to an inverse impact of 0.5% on S&P 500 earnings per share. The recent rolling over in the USD (albeit slight) has also represented a support for the bull case for stocks.
Dollar hits int'l sales
Source: Charles Schwab, Bloomberg, as of 10/28/2022. Data indexed to 100 (base value = 12/31/2021). Goldman Sachs (GS) domestic Sales basket contains 50 S&P 500 stocks with the highest domestic revenue exposure. Goldman Sachs (GS) international Sales basket identifies 50 S&P 500 companies across 11 sectors with the highest international sales. Indexes are unmanaged, do not incur management fees, costs and expenses and cannot be invested in directly. Past performance is no guarantee of future results.
Leadership shifts and performance divergences
In general, "big tech" (a basket that generally also includes consumer and communications stocks as well) has higher international/currency risk. The dynamic has clearly shifted with the cohort no longer a market leader, giving up its dominance leading into—and during the initial phases of—the pandemic. Growing divergences among the cohort are also notable.
Case in point has been Apple's relatively muted -14% drawdown from its all-time high, a serious divergence from Amazon's -45% drop and Meta's -74% decline. As has been emphasized by the current earnings season, gone are the days (for now) where we can look at these companies with a monolithic lens. Inflation and the evaporating liquidity tide have set some companies back by a significant degree, resulting in a meaningful change for the structure of the market.
Outlook, look out?
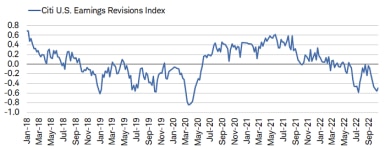
Including the aforementioned bellwethers, forward earnings estimates have been deteriorating. As shown below, after a brief lift toward positive territory, the Citi U.S. Earnings Revisions Index sank again into negative territory. We continue to believe the path of least resistance for earnings estimates for the remainder of this year and into at least the first half of next year is lower.
Negative net revisions
Source: Charles Schwab, Bloomberg, as of 10/21/2022. Citi U. S. Earnings Revisions Index measures the number of equity analyst revisions upgrades (positive) and downgrades (negative).
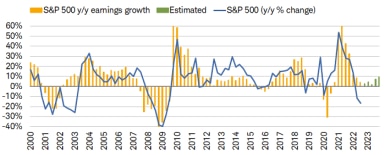
As shown via the bars in the chart below, S&P 500 earnings are currently expected to be in a troughing process before likely starting to rebound next year. The massive descent in earnings from their second-quarter 2021 peak of nearly 100% (the chart is truncated, as detailed in the footnote) has been more than reflected in the year-over-year change in the S&P 500 (blue line). If we are wrong, and the consensus for earnings into next year are accurate, it becomes easier to argue that stocks have already priced in earnings weakness.
Stocks track earnings growth
Source: Charles Schwab, I/B/E/S data from Refinitiv, as of 10/28/2022. 4Q08's reading of -67% is truncated at -40%, 4Q09's reading of 206% is truncated at 80%, and 2Q21's reading of 96% is truncated at 60%. Forecasts contained herein are for illustrative purposes only, may be based upon proprietary research and are developed through analysis of historical public data. Past performance is no guarantee of future results.
Numbing numbers
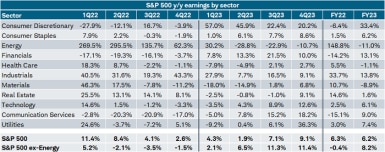
For a full look at this year's earnings picture, along with detailed estimates for next year, see the table below from Refinitiv. Highlights include the expectation that only this year's first quarter will have been positive for S&P 500 earnings if the Energy sector is excluded. Even the second quarter's touted 8.4% earnings growth was down more than -2% ex-Energy. In the third quarter, like was the case in the first half of the year, the Energy sector has dominated all other sectors with its eye-popping growth rates. Seven of the 11 S&P 500 sectors are expected to see a contraction in earnings for both the third and fourth quarters.
Sector details
Source: Charles Schwab, I/B/E/S data from Refinitiv, as of 10/28/2022. Forecasts contained herein are for illustrative purposes only, may be based upon proprietary research and are developed through analysis of historical public data.
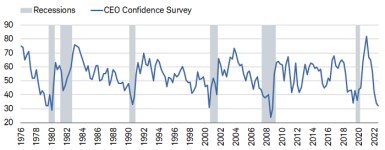
Stimulus leads activity with variability in terms of timing. The massive fiscal and monetary stimulus unloaded during the worst phases of the pandemic boosted corporate revenues, while the attendant inflation initially helped corporate pricing power. But the "bill" is coming due. Based on the plunge in The Conference Board's CEO Confidence, shown below, it suggests recession risk is high and S&P 500 earnings are at risk of moving into negative year-over-year territory before long.
CEOs' no-confidence vote
Source: Charles Schwab, The Conference Board Measure of CEO ConfidenceTMin collaboration with The Business Council, as of 4Q22.
In sum
The most important messages emanating from third quarter earnings season so far are a weakening demand environment, high input costs (including labor), the effects of the strong USD and the impact of the Fed's aggressive rate hiking cycle. Of note is the breadth of hits in terms of industries—with not only technology feeling the pressure, but also housing, autos, communications—and especially those segments of consumer/retail that were the biggest beneficiaries of the stimulus-fueled early stages of the pandemic.
 By
By
 By
By
