We Can Work It Out: Update on Labor Market
 By
By
 By
By

“Jobs day” last Friday was a bit of a dud. At the headline level, nonfarm payrolls disappointed with a gain of 199k, which undercut the consensus estimate of 450k. November’s gain was revised higher from 210k to 249k, but that wasn’t enough to offset the miss in December. As was the case in November, there was yet another wide divergence between the headline payroll and household surveys (the latter increased by 651k). That underscores the reality that seasonal quirks remain a factor. The large jump in household employment trounced the more subdued increase in the labor force; hence the drop in the unemployment rate, which is calculated based on the household survey.
Household Survey Jobs > Payrolls
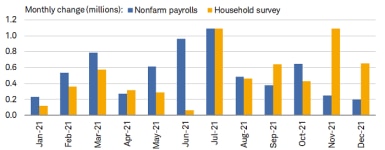
Source: Charles Schwab, Bureau of Labor Statistics, as of 12/31/2021.
At the sector level, it’s clear that services jobs helped drive overall payrolls, given leisure & hospitality added 53k jobs and professional & business services added 43k jobs. The only rub with the former cohort is that payroll data was collected before omicron-related restrictions and closures; and as such, January may bring a bit of a drag for the sector. Additionally, the retail sector saw a decline in payrolls for the second month in a row, which unfortunately confirms some weakness in demand and consumption toward the end of 2021.
Leisure/Hospitality on Top Again
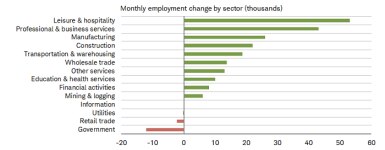
Source: Charles Schwab, Bureau of Labor Statistics, as of 12/31/2021.
Fortunately, we are starting to get some more clarity on the wage data. Average hourly earnings rose at a 4.7% annual rate in December, which (as shown below) is still quite strong relative to history but is down slightly from the most recent peak of 5.1% in November. Mix-shift effects are always at play with this series, but we’re clearly moving past the distortions, which caused the boom in 2020—when low-paying jobs were cut at a disproportionate rate—and the bust in 2021, when those jobs started to come back.
Wages Ticked Down
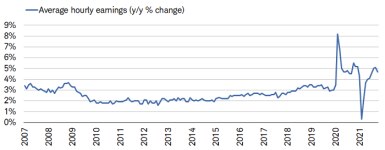
Source: Charles Schwab, Bureau of Labor Statistics, as of 12/31/2021.
Our preferred measure for wage growth—especially given the aforementioned mix-shift problems—is the Atlanta Fed’s Wage Tracker. Instead of a simple average, it is a median measure of wage growth and eliminates those mix-shift biases. As shown below, its 4.3% growth rate is climbing closer to that of average hourly earnings, but the volatility in 2020 and 2021 was much more subdued. The surge in wages was evident later last year, driven by low-paying jobs coming back online—an unsurprising development, given pay and salaries have had to move up at a faster rate to attract workers who are re-entering the lower-paying services industry. The spread between wage growth for the lowest and highest earners has stopped expanding for now. Though we expect some convergence this year, it’s too soon to call a reversal in the diverging trend.
Lower Earners’ Higher Wage Growth
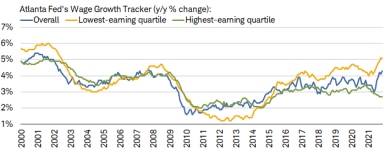
Source: Charles Schwab, Bloomberg, as of 11/30/2021. Atlanta Fed’s Wage Growth Tracker is a measure of the nominal wage growth of individuals.
Another confirmation of a tighter labor market is the drop in the unemployment rate from 4.2% to 3.9%. As shown in the chart below, it is closing in on the pre-pandemic low of 3.5%. Not only that, but longer-term scarring in the economy is receding again, evidenced by the drop in the number of individuals without a job for 27 weeks or longer. There was a minor tick up in November, but December’s move down confirmed the trend remains intact—with less than one-third being long-term unemployed vs. more than 40% in early 2021.
Unemployment Rate Now < 4%
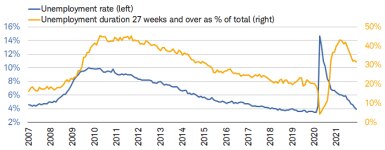
Source: Charles Schwab, Bureau of Labor Statistics, as of 12/31/2021.
Following the early days of the pandemic—when temporary layoffs were plunging—there was a troubling delay in a lower trajectory for permanent job losses. Shown below is the massive downturn in not only temporary layoffs—but more recently, permanent layoffs as well— confirming that labor market scarring is healing quite rapidly. This is also supported by the fact that during the depths of the pandemic, those remaining unemployed were contributing 7.5% to the headline unemployment rate. As of December 2021, that share had fallen to 2%.
Temporary & Permanent Both Lower
![The number of unemployed on temporary layoff in December was 812k while permanent job losers were 1.7m.]](/sites/g/files/eyrktu871/files/styles/embedded_385/public/011022_f_temp%20vs%20perm.png?itok=XMH3PMto)
Source: Charles Schwab, Bureau of Labor Statistics, as of 12/31/2021.
Shifting to a leading labor market indicator, job cuts are still trending downward on an annual basis. As shown in the chart below, announced cuts (tracked by Challenger, Gray & Christmas) fell 75% year-over-year in December. That marks the 11th consecutive month of declining cuts; and given that strength, 2021 had the lowest annual sum of job cuts on record going back to 1993. This remains one of the clearest indications that demand for labor has not waned at all for the better part of the past year.
Job Cuts Remain Historically Low
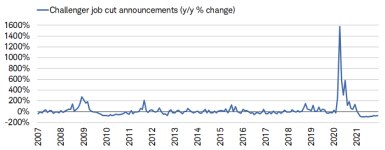
Source: Charles Schwab, Bloomberg, as of 12/31/2021.
While we know demand for labor remains quite strong, the labor supply picture remains a bit murky. For a host of reasons, millions of Americans have yet to return to the labor force; made clear by the mediocre increase in the labor force participation rate, as shown below. Overall participation has essentially moved sideways since late-2020; and though prime-age participation (ages 25-54) has improved at a better rate, both series have substantial ground to make up. As we have continued to argue, increased participation is key for the labor market’s continued expansion, an easing in inflationary pressures, and robust economic growth.
LFPR’s Achingly Slow Recovery
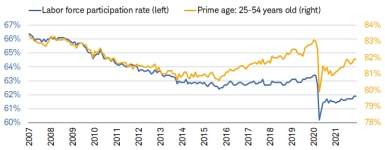
Source: Charles Schwab, Bureau of Labor Statistics, as of 12/31/2021.
One area that may offer clues as to whether participation moves up is the quits rate, which, as of November, remains at its all-time high of 3%. Historically, a higher quits rate has coincided with a strengthening labor market and economy. The rub in the current environment is the rapidity with which quits have soared, but it isn’t all bad when looking at rates across sectors. As shown below, the leisure & hospitality sector is driving the overall rate higher; and though retail quits are also high, the remaining sectors have more modest quits rates.
“Great Resignation” Continues
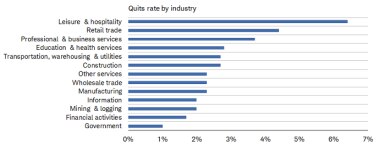
Source: Charles Schwab, Bloomberg, Bureau of Labor Statistics, as of 11/30/2021.
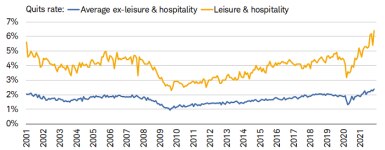
The outsized impact from leisure & hospitality can be seen in the next chart. The average quits rate excluding that sector is more modest, albeit also at an all-time high.
Leisure/Hospitality Driving High Quits
Source: Charles Schwab, Bloomberg, Bureau of Labor Statistics, as of 11/30/2021.
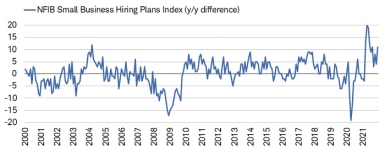
The good news for now is that, despite workers leaving their jobs in droves and demanding higher wages, small businesses have not pulled back on their hiring plans. As shown in the chart below, hiring plans per the NFIB survey have been increasing on an annual basis for a while, despite the trend weakening from the peak in May 2021.
Small Business Hiring Plans Up Again
Source: Charles Schwab, Bloomberg, National Federation of Independent Business (NFIB), as of 12/31/2021.
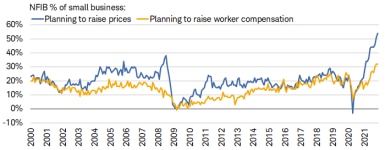
The need for workers has coincided with decisions to hike both prices of goods and services, and worker compensation. As shown below, price increases are outpacing compensation increases by a marked degree—helping add to inflationary concerns—underscoring the pressures many small businesses are facing when it comes to higher input costs and difficulty in finding labor.
Price Hikes > Wage Hikes
Source: Charles Schwab, Bloomberg, National Federation of Independent Business (NFIB), as of 11/30/2021.
The conundrum is confirmed by the portion of the NFIB survey that asks respondents about their company’s single most important problem. While labor quality remains the chief concern, inflation has surged in importance and is now tied with taxes as the second most important problem. This is closing in on a level similar to the global financial crisis era, when inflation was the dominant thorn in businesses’ sides (though for a brief period).
Inflation Now 2nd Biggest Problem

Source: Charles Schwab, Bloomberg, National Federation of Independent Business (NFIB), as of 11/30/2021.
In sum
The labor market remains tight—hence the stepped-up pace of balance sheet tapering by the Federal Reserve, and the market now expecting three rate hikes this year. One historical nugget of truth to keep in the back of your mind as the Fed embarks on its rate hiking cycle: in the post-WWII era, every time (12 occurrences) that the Fed was raising rates—and the three-month moving average of the unemployment rate rose by at least .35 percentage points—a recession has unfolded. For now, the good news is that the unemployment rate continues to descend; but keen observers will understand the potential economic implications of an eventual turn back up—especially if rate hikes are still underway.
What You Can Do Next
Follow Liz Ann Sonders on Twitter: @lizannsonders
Explore other topics on Insights & Ideas.
Talk to us about the services that are right for you. Call us at 800-355-2162, visit a branch, find a consultant or open an account online.