Has the Bitcoin Bear Market Passed the Pain Test?

The current bitcoin bear market has inflicted plenty of pain. But how much pain is enough?
Yes, bitcoin's down about 50% from its October 2025 high, with roughly $1.2 trillion in market capitalization lost. For a lot of people, that hurts, no doubt.
But as the cryptocurrency tries to pull away from its most recent bear-market low, market observers and investors are debating whether the bottom is finally in. Part of that debate is whether we've seen capitulation—the kind of sharp, sustained declines that are so nasty that any investor who's not absolutely committed for the long haul finally says, "I'm out."
There's no way to confirm capitulation until after the fact, and not every bear market shows clear signs of capitulation even after it's over. But we can see that, at the very least, bitcoin's deepest bear markets over the past decade or so have inflicted much bigger collective losses on investors, according to on-chain data from Glassnode. That includes the kind of losses that, in retrospect, could signal capitulation.
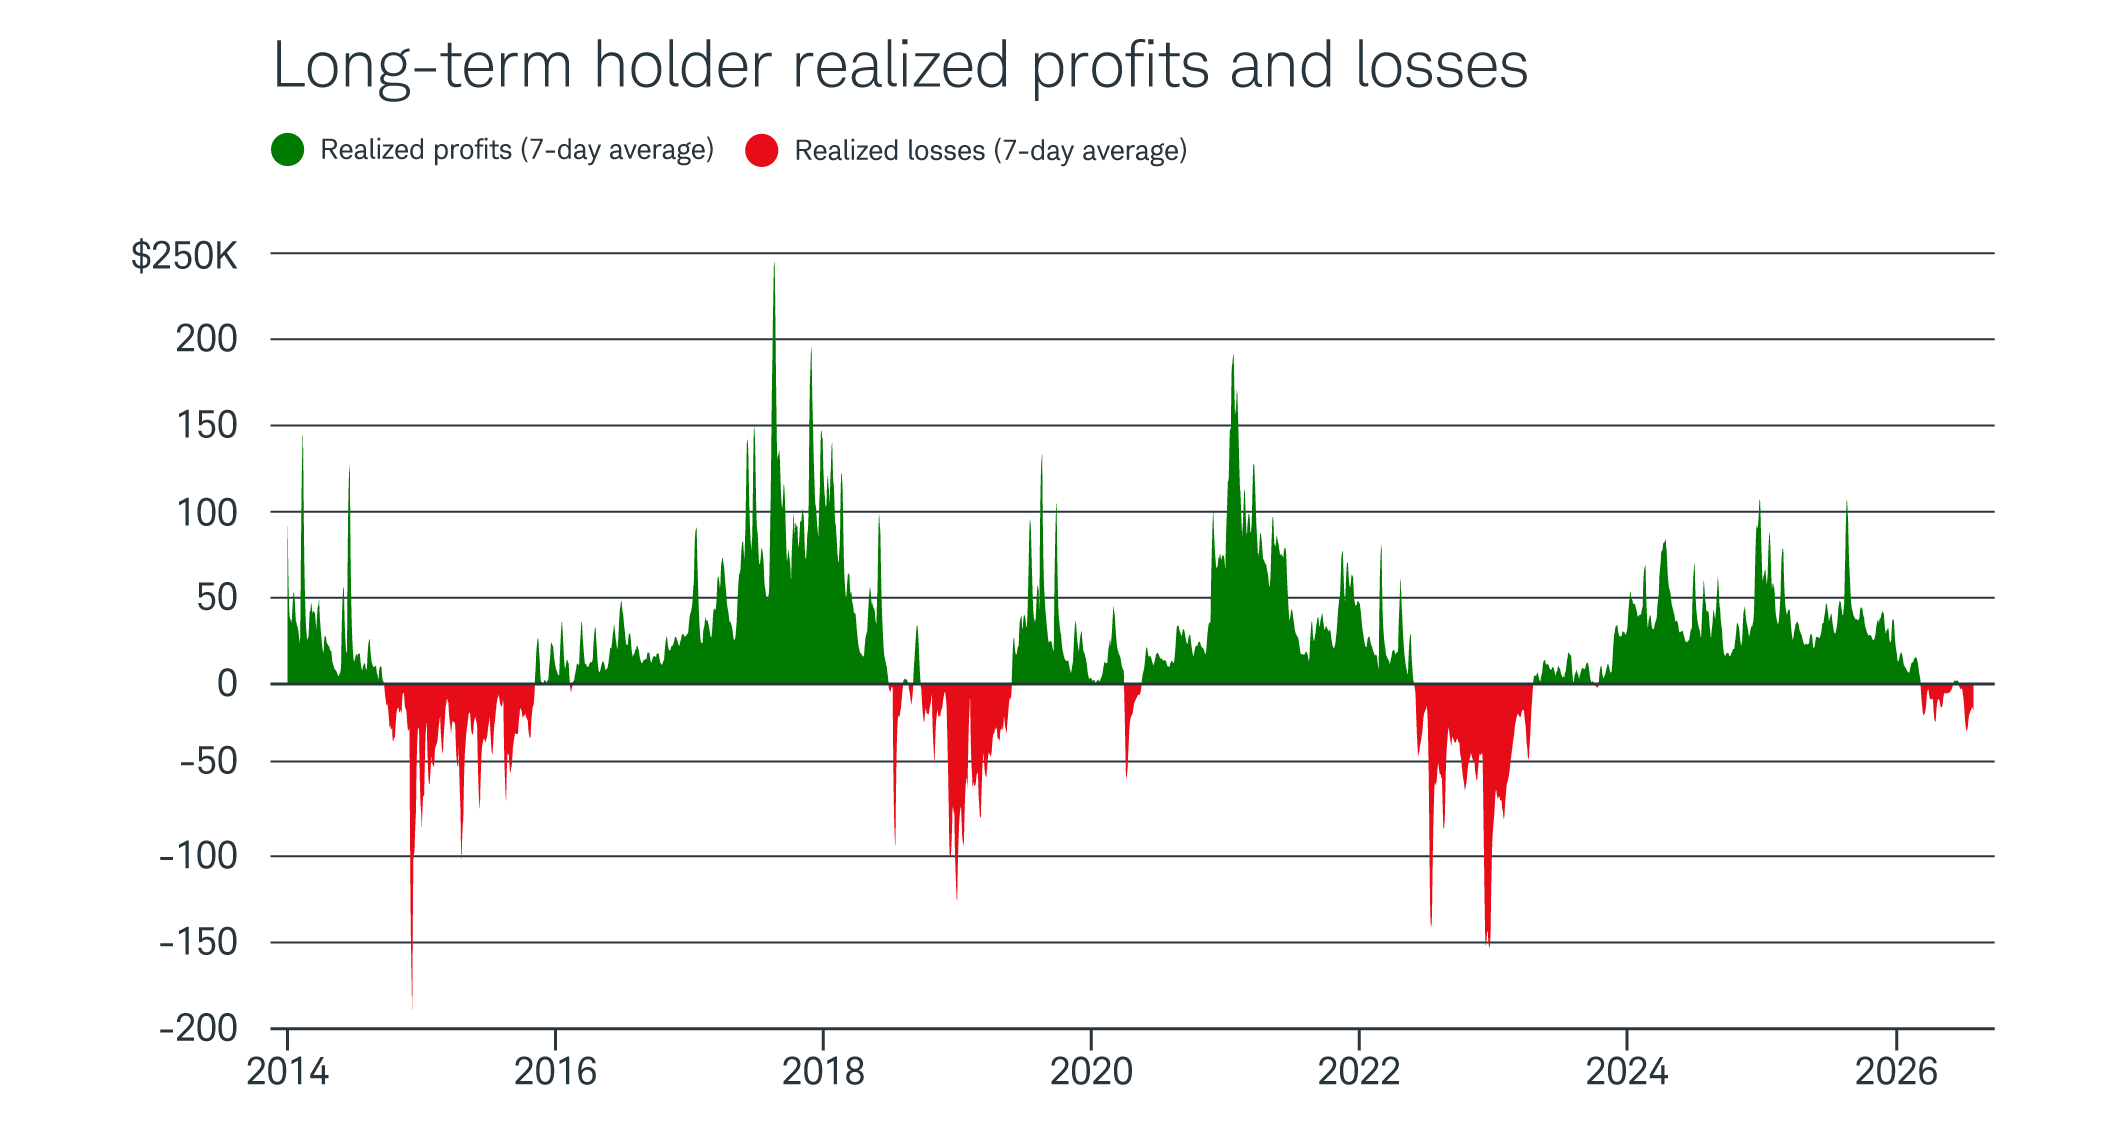
Dating back to 2013–14, bitcoin investors have endured four major bear markets that have lasted six months or longer—not including the current one. The average decline across these markets was 77%. As the chart below shows, during three of those—2013–15, 2017–18, and 2022—long-term investors (defined by Glassnode as those holding coins for 155 days or more) suffered massive net realized losses, illustrated by clusters of red with several deep spikes.
Losses were more limited in the fourth example (2019–20) but still produced a deeper spike than anything seen in the current, relatively orderly downturn.
Source: Glassnode
For illustrative purposes only.
Given bitcoin's volatility, we used only major downturns—rather than the standard 20% equities guideline—to define a bear market. Bitcoin fell 20% or more numerous times during that span with little impact on the trend. Seven such declines lasted less than a month. In one case, a 21% decline over four days brought bitcoin only to its 50-day moving average.
Unrealized losses and the realized price
What about current long-term investors who are still holding their positions? How much pain they might be willing to endure could serve as a better indicator of the potential for another leg down. Just as with realized losses, unrealized losses make the current bear market look far less painful than most of those with similar or bigger declines over the past decade or so.
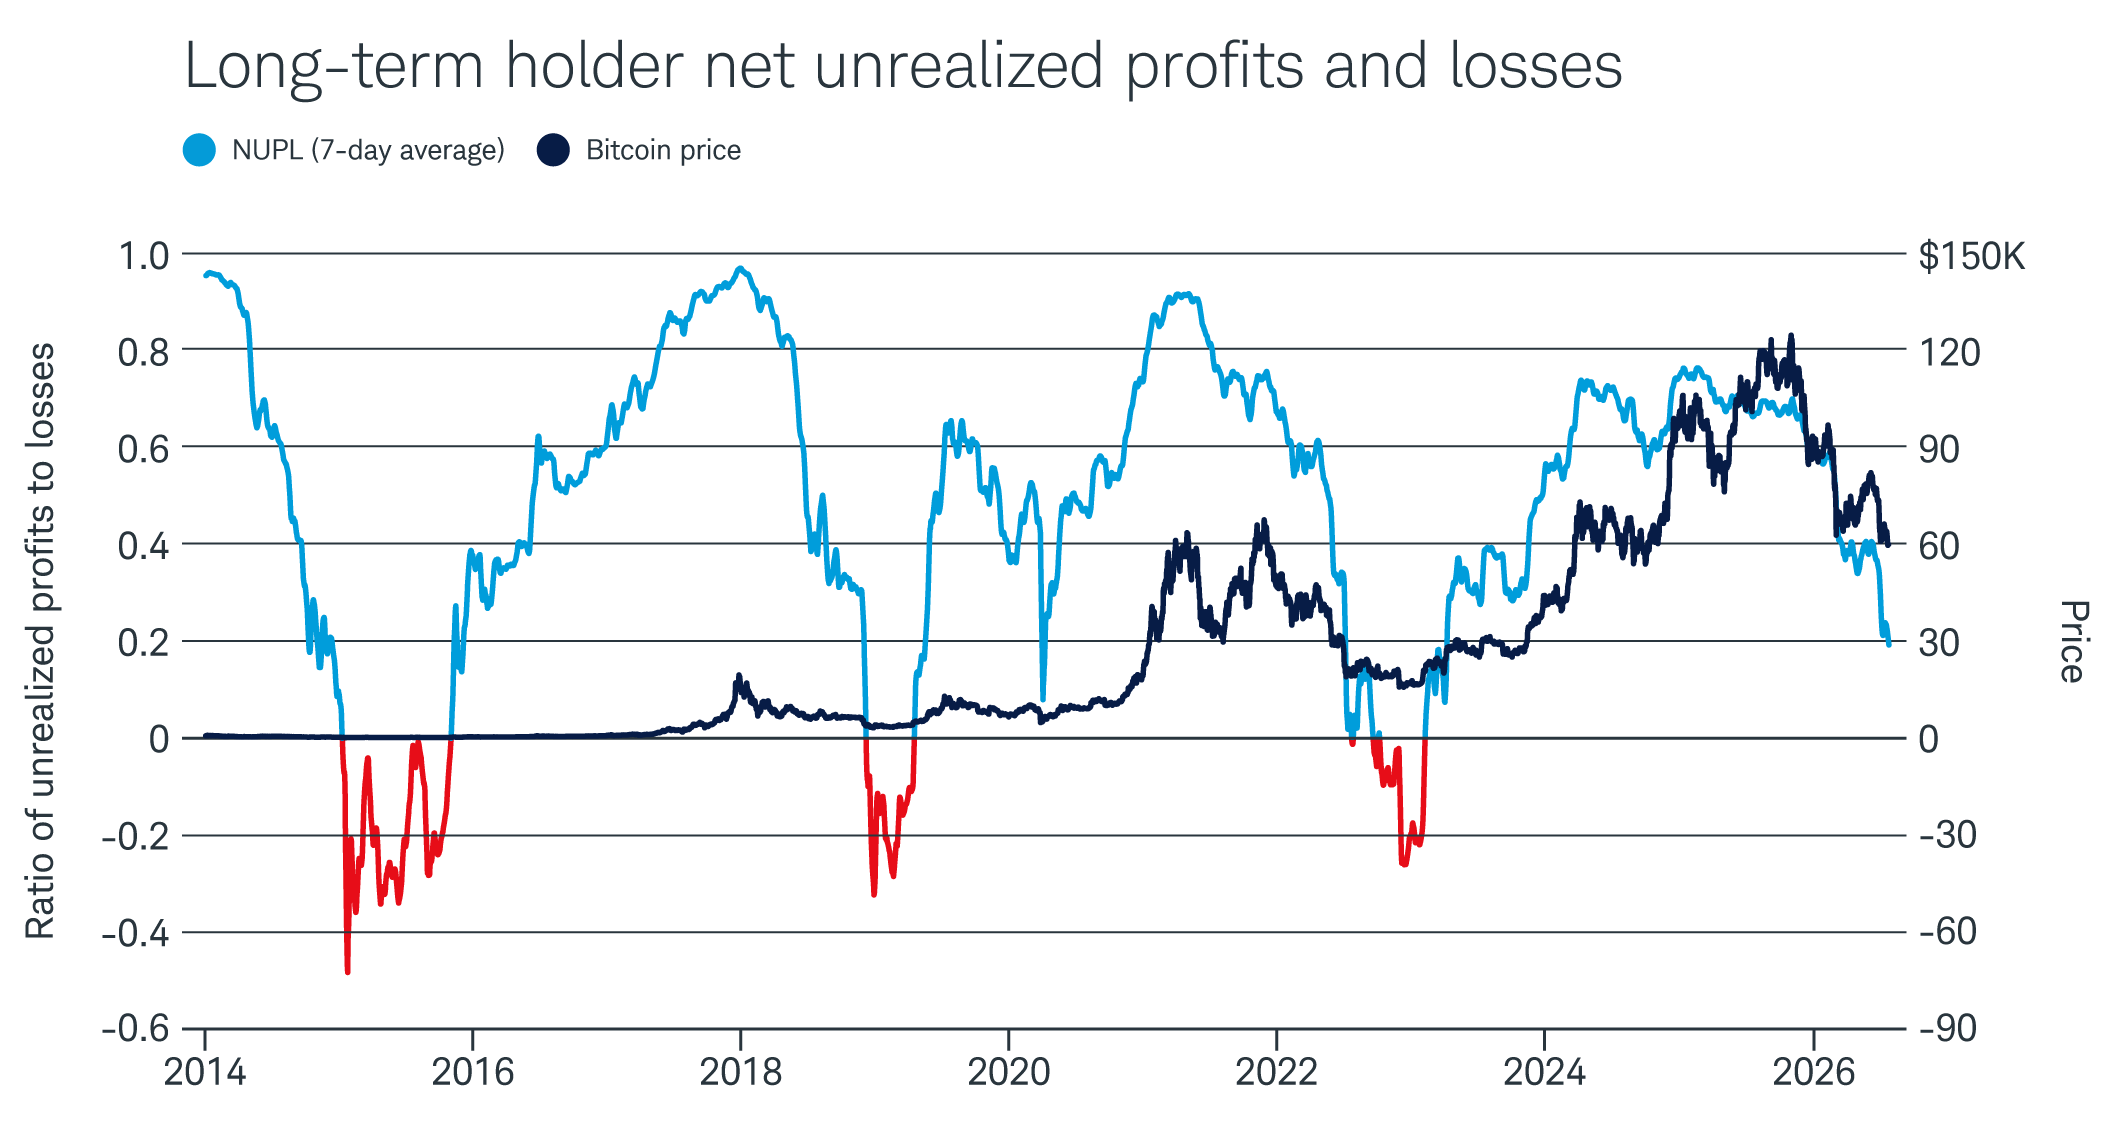
Glassnode's net unrealized profit/loss (NUPL) metric for long-term holders has remained in positive territory throughout the current downturn, which means the long-term investor cohort is still sitting on net unrealized profits. Compare that to the 2013–15, 2018–19, and 2022 bear markets. During all of these, the indicator fell into negative territory for an extended time. (While there's no official industry definition of capitulation, Glassnode classifies a negative NUPL reading as its capitulation zone.)
Source: Glassnode
For illustrative purposes only.
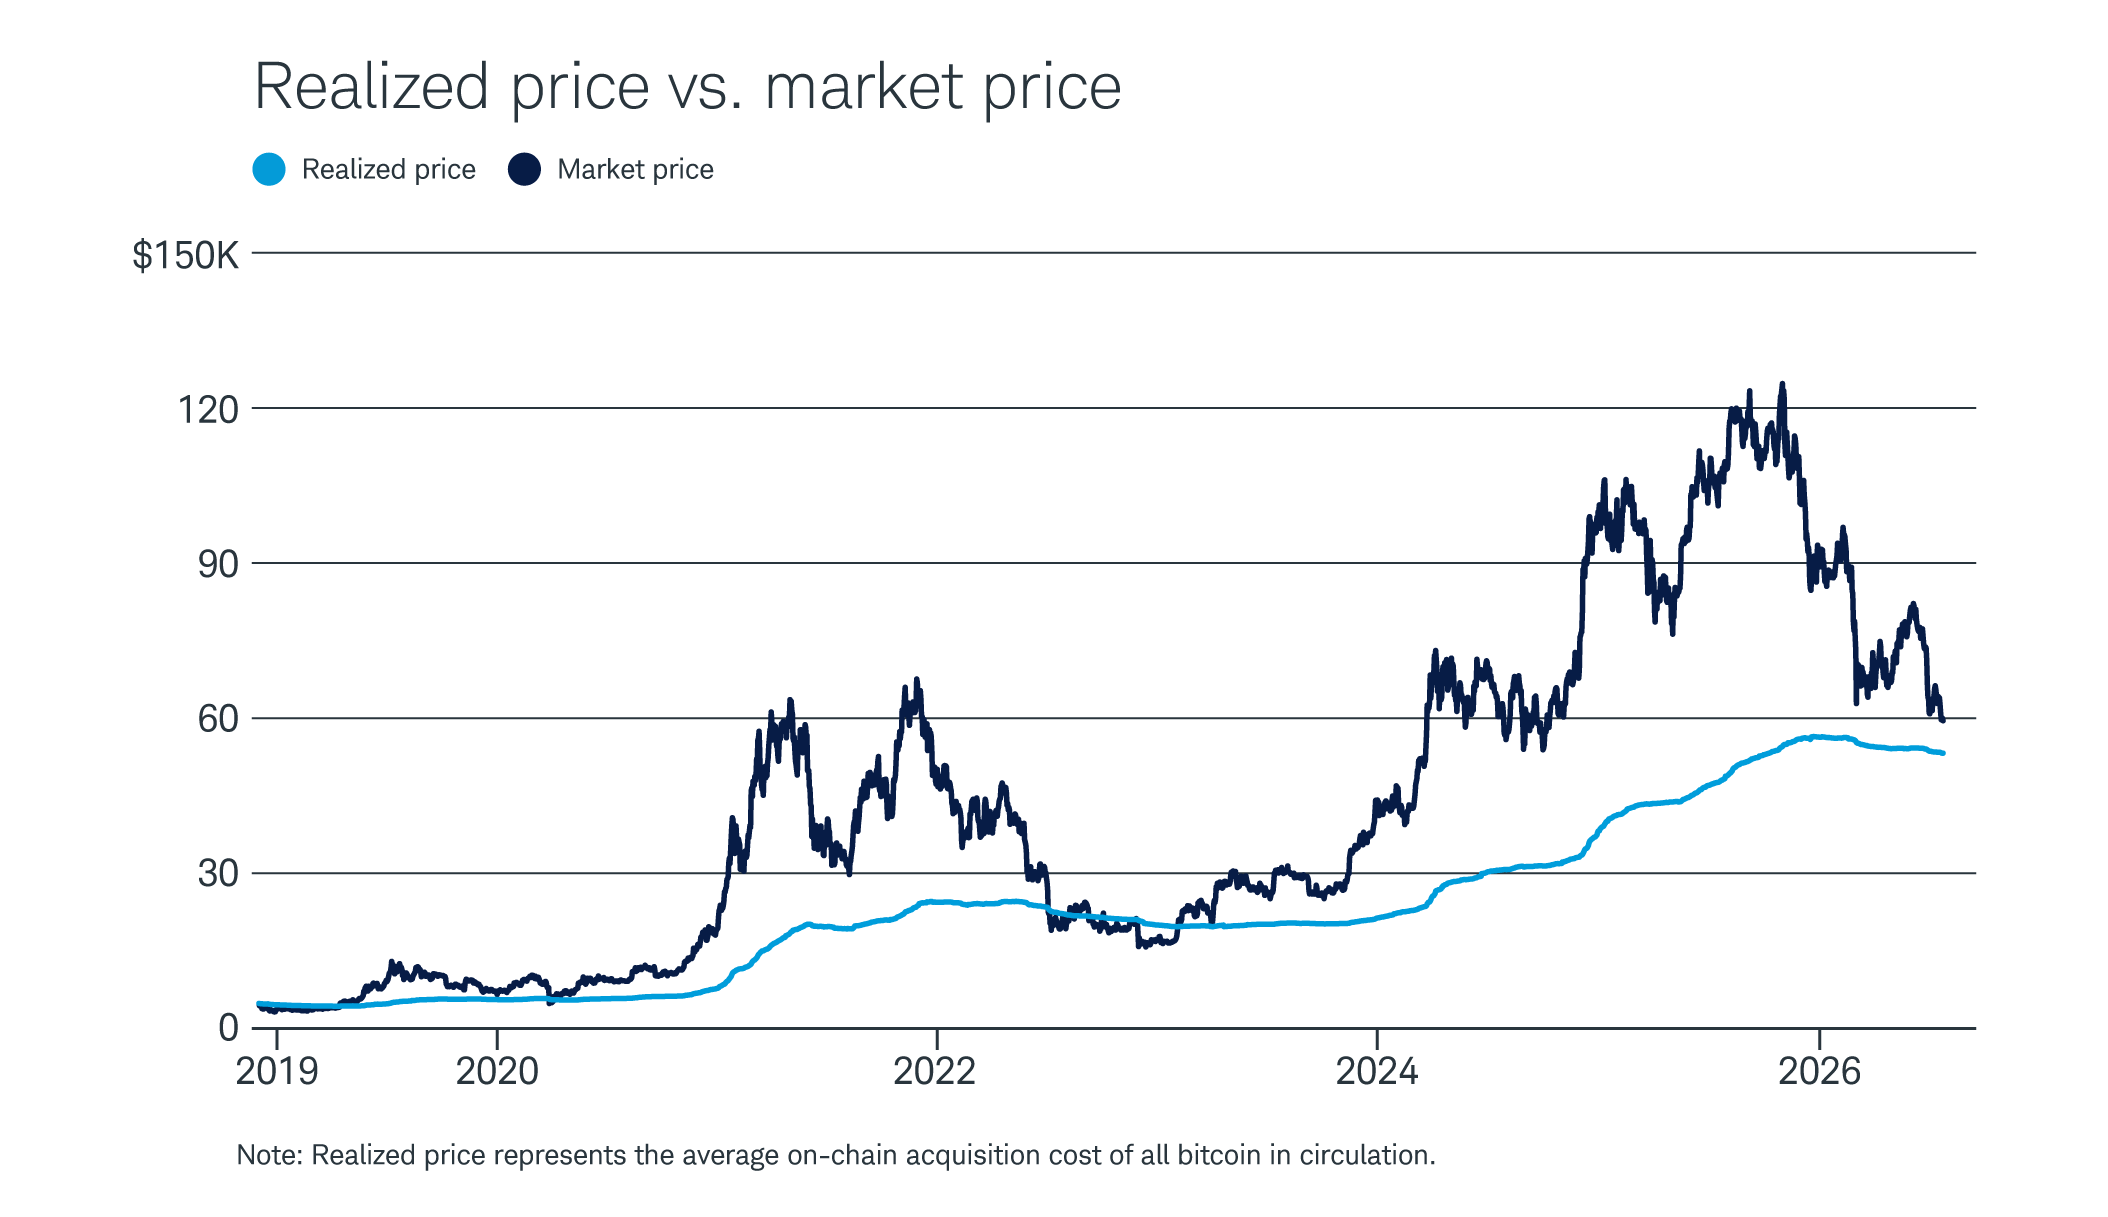
The realized price metric points to what some analysts consider strong support in a deep bear market and a potential bottom. During the 2017–18, 2019–20, and 2022 bear markets, bitcoin's spot price fell below its "realized price," defined by Glassnode as the average on-chain acquisition cost of all bitcoin in circulation. Think of the realized price as a collective break-even level—a threshold that could help illustrate overall market psychology. Currently, the realized price is about $53,000, roughly 16% below the July 6 market price.
Source: Glassnode
For illustrative purposes only.