Rising Prices for Services Complicate Fed's Job

It was looking like Federal Reserve policymakers and new Chair Kevin Warsh had caught a break in their inflation battle after oil prices had briefly fallen to about pre-Iran war levels. That reprieve seems less certain now after attacks resumed last week, but regardless of what oil prices do, the Fed will have plenty to keep it busy as a raft of inflation data for June comes out this week.
Core inflation, which excludes energy and food, remains well above even the Fed's 2% target for headline inflation. The core version of the Fed's preferred gauge, the Personal Consumption Expenditures (PCE) index, rose 3.4% in May, the most since October 2023.
Services inflation remains stubbornly elevated, as it was before the war started, and in recent months, it's accelerated—even when excluding energy services. The same is true for inflationary pressures at the producer level, which have reached multi-year highs, which could prompt more businesses to start passing price hikes on to consumers in coming months.
In other words, even if oil prices remain contained, which isn't a given, the Fed might yet have a real battle on its hands. As of early July, Warsh's preferred trimmed gauges, which eliminate more volatile price categories to focus on the underlying trend, sit above 2% and have turned higher.
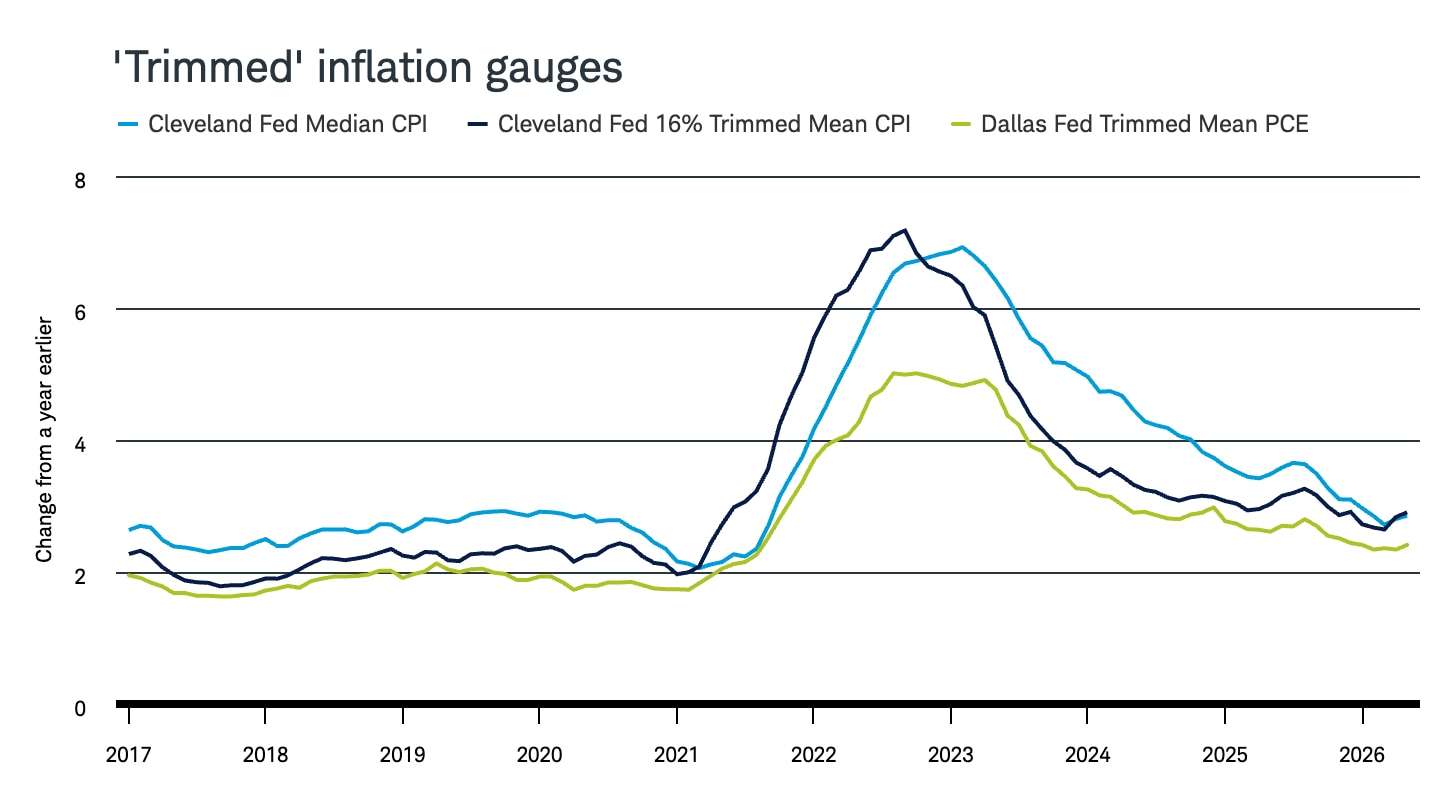
Sources: Federal Reserve Bank of Cleveland, Federal Reserve Bank of Dallas
For illustrative purposes only.
Here's what to watch when Consumer Price Index (CPI) data is released Tuesday and Producer Price Index (PPI) data comes out Wednesday.
Services inflation gains steam
CPI services excluding energy will be a key metric. In May, it rose for a third consecutive month for the first time since February 2023 and drove about half of the 4.2% headline CPI inflation number that month. It had remained stubbornly high, lagging well behind overall inflation on the way down from the 2022 peaks, and only finally dipped just below 3% in recent months before climbing to 3.4% in May.
The biggest driver within the category was shelter, or housing and related expenses, which has a 35% weighting in the headline index. This metric also rose 3.4% in May.
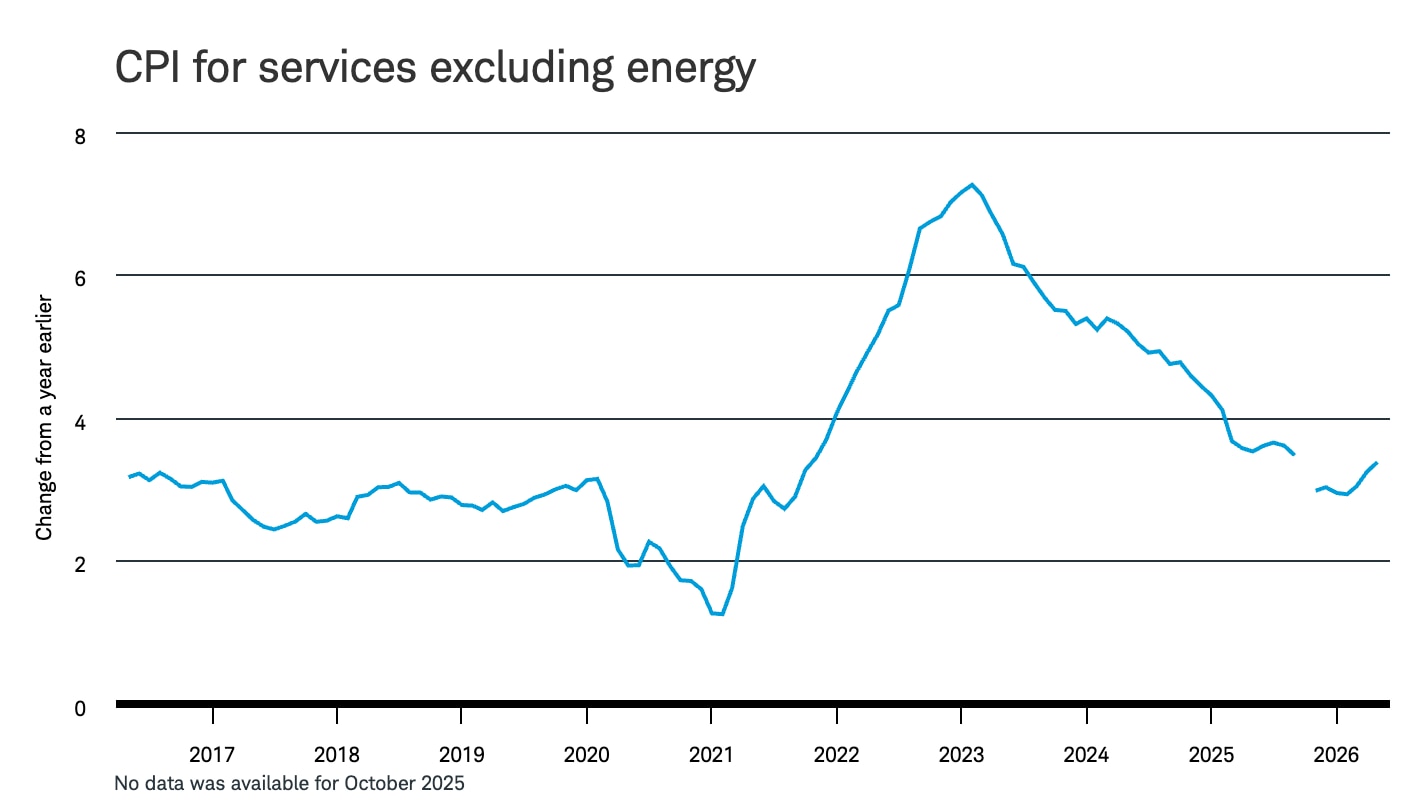
Sources: Bureau of Labor Statistics, Federal Reserve Bank of St. Louis
For illustrative purposes only.
Services were an even bigger driver of May's PCE headline price index, accounting for 0.28 percentage point of the 0.4% month-over-month increase in PCE prices. Four of the five biggest contributors to the price index that month were services: financial services and insurance; healthcare; housing and utilities; and "other services." (Gasoline ranked fifth, contributing 0.16 percentage point to the increase.)
Upstream pressures rise
At the producer level, PPI data from May offered more evidence that upstream inflationary pressures are building. PPI for final demand rose 6.5% from a year earlier, the biggest jump since November 2022. Energy drove much of the surge in the headline index, but other gauges suggested that upstream inflation is broader than higher oil and gas prices.
Keep an eye on PPI for final demand excluding food, energy, and trade services, which strips out the noisiest categories. In May, it rose 5.1% from a year earlier, the fastest annual increase since 2022.
Another PPI indicator to watch this week is the trade services margin, a measure of how much wholesalers and retailers are marking up prices. In April, this volatile category spiked to the highest level in more than a decade before falling in May. Another big jump would be an unwelcome sign for the Fed.
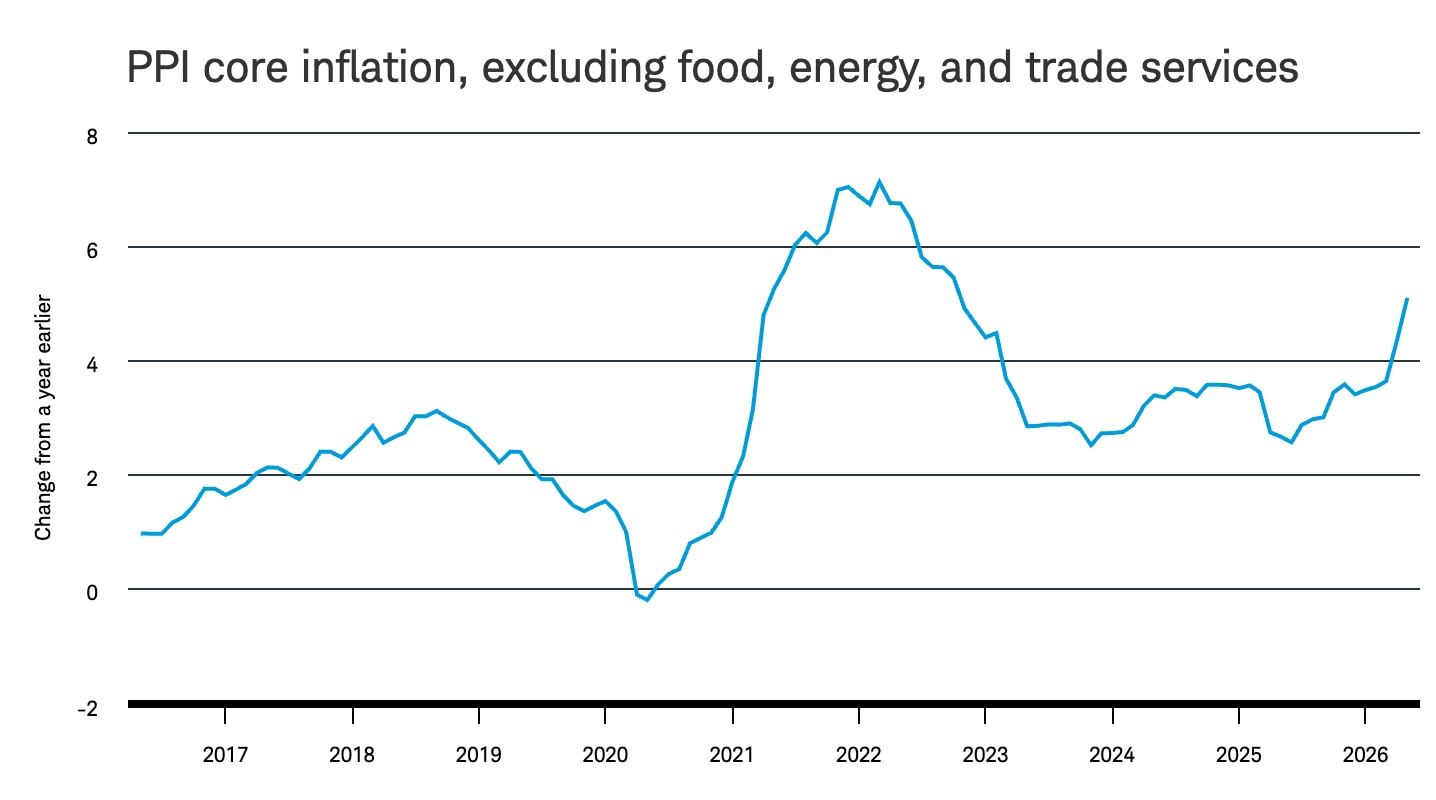
Sources: Bureau of Labor Statistics, Federal Reserve Bank of St. Louis
For illustrative purposes only.