Insights & Education
Keeping you at the forefront of modern investing
The latest commentary
Perspective: In the Dark


Stocks Flat, Credit Fear Eases

Government Shutdown Update

Data Options During Shutdown

Q3 2025 Bank Earnings On Tap
Popular in trading

Rules For Cash Trades

Ins and Outs of Short Selling

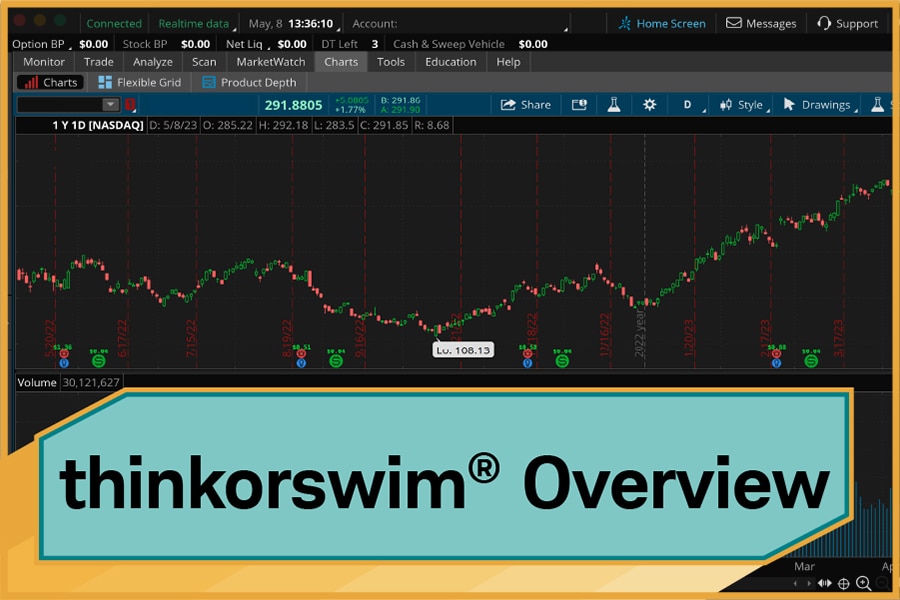
Intro to thinkorswim® Desktop

Trading Futures vs. Stocks
Planning and retirement
Talking Money with Mom and Dad


Giving With Noncash Assets

How to Plan for Life's Goals

Inherited IRA & SECURE Act 2.0

Money Gifts with Guilt

9 Scary Money Mistakes
Schwab original podcasts

Onward magazine

Financial Planning
Behavioral Finance
Financial Planning
Estate Planning
Explore more topics
The information provided here is for general informational purposes only and should not be considered an individualized recommendation or personalized investment advice. The investment strategies mentioned here may not be suitable for everyone. Each investor needs to review an investment strategy for his or her own particular situation before making any investment decision.
All expressions of opinion are subject to change without notice in reaction to shifting market conditions. Data contained herein from third-party providers is obtained from what are considered reliable sources. However, its accuracy, completeness or reliability cannot be guaranteed.
Examples provided are for illustrative purposes only and not intended to be reflective of results you can expect to achieve.
Options carry a high level of risk and are not suitable for all investors. Certain requirements must be met to trade options through Schwab. Please read the Options Disclosure Document titled "Characteristics and Risks of Standardized Options" before considering any option transaction. Call Schwab at 1‐800‐435‐4000 for a current copy. Supporting documentation for any claims or statistical information is available upon request.
Investing involves risks, including loss of principal. Hedging and protective strategies generally involve additional costs and do not assure a profit or guarantee against loss. With long options, investors may lose 100% of funds invested. Spread trading must be done in a margin account. Multiple leg options strategies will involve multiple per-contract charges. Covered calls provide downside protection only to the extent of the premium received and limit upside potential to the strike price plus premium received.
Futures and futures options trading involves substantial risk and is not suitable for all investors. Please read the Risk Disclosure Statement for Futures and Options prior to trading futures products. Futures and forex accounts are not protected by the Securities Investor Protection Corporation (SIPC). Futures, futures options, and forex trading services provided by Charles Schwab Futures and Forex LLC. Trading privileges subject to review and approval. Not all clients will qualify.
Charles Schwab Futures and Forex LLC (NFA Member) and Charles Schwab & Co., Inc. (Member FINRA/SIPC) are separate but affiliated companies and subsidiaries of The Charles Schwab Corporation.